Data always exist at library level and sometimes at relational level.
The library is merely a storage container for items like domains, processes, risks, control measures, transaction codes etc.
Each of these items - used to store specific values - exists in tables and can be displayed using the library.
This implies that each new entry made (at relational level) is automatically saved in the library as well.
The library bears no relationships between the multitudes of various items within scope.
This level creates a multidimensional view of the existing items.
The library stores the individual items without any form of relations among various items.
In contrast with this 'hollow' representation form, the relational level displays the relations among the various items.
By doing so it creates a real-life infrastructure which represents the items and their interconnections as they exist in the real life infrastructure of your organization.
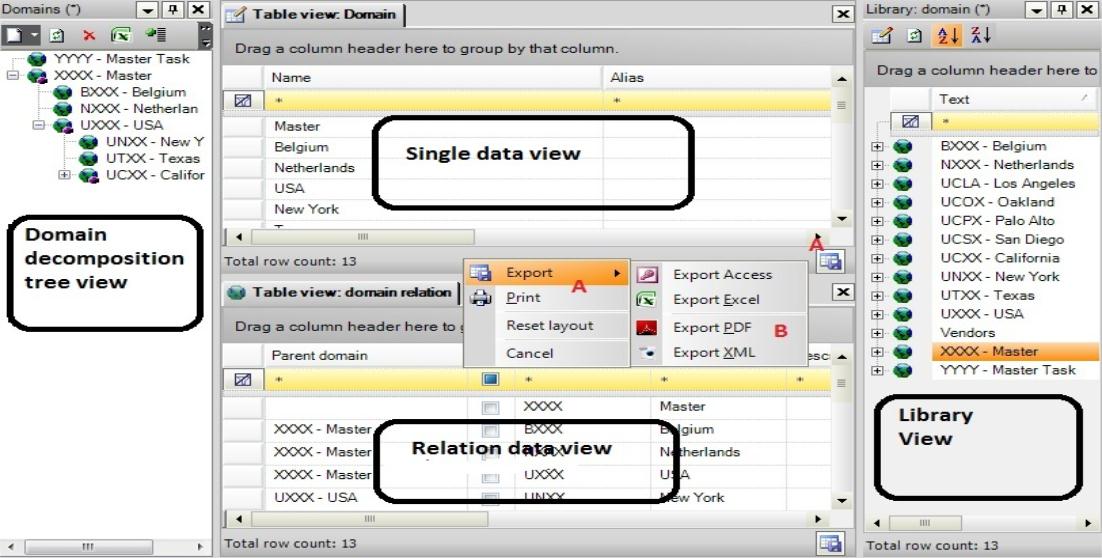
The treeview on the left is the Domains decomposition tree view.
The Table view: domain relation , the view below in the middle, is the Relation data view (of the domains).
The upper view in the middle ( ) is the Single data view (of the domains).
Then pane on the right is the Library view (of the domains).
Click the Export icon (A) ( ) to get the export menu.
Indicated with A & B on the screenshot above.
B: (From top to bottom) This menu is available by means of a right-click on the toolbar anywhere left of the 4 buttons discussed in section A.
Note: When clicking the Access, Pdf, Excel, Xml or Print button, all expandable entries will be printed in 'expanded mode'.
There are however 2 exceptions to this feature (in order to prevent the application from locking up in case of very large data views). These 2 exceptions are the Composite - single role relations (FuTa) detail view and the User - Role assignments detail view.
These 2 views will be printed/exported to Access, Excel, Xml or Pdf on a WYSIWYG base (which means that only the tree-entries which are expanded on screen will be printed in expanded-mode).
When hovering your mouse cursor over the column header, a tooltip appears that provides you with a description for this column. This tooltip will not appear for each column but is available in case the column header is too small to provide the description - especially for columns which represent a boolean value.
The status bar shows the row count of the grid. The row count does not include the empty line(s) in the grid.
Columns in a grid can be moved. Drag a column to another location and drop it. It will stay where it was released.
All column positions and widths are remembered for each form.
A grid control that has this icon ![]() can switch to be a selection control.
can switch to be a selection control.
And back to a multi select grid using this icon ![]() .
.
The selection control allows to filter rows and keep the filter in a scheduler file.
The filter will correctly filter out data when the list changes, which is not possible with the multi select list.
This document is up to date with version 11.1.12.31 of CSI Accelerator